- ※Data prior to FY2022 can be viewed from the above PDF.
Environmental Data
| Unit | FY2023 | FY2024 | Remarks (coverage,tabulation method) | ||
|---|---|---|---|---|---|
| Violation of environment-related laws and regulations | Cases | 0 | 0 | ||
| GHG(CO2) emissions | Total | t-CO2 | 1,012,243 | 1,058,777 | |
| Scope 1 | t-CO2 | 331 | 334 | ||
| Scope 2 | t-CO2 | 211 | 179 | ||
| Scope 3 | t-CO2 | 1,011,071 | 1,058,264 | ||
| GHG(CO2) emissions:Intensity | Scope 1+2 | 1.75 | 1.64 | Per 1 billion yen of sales | |
| Scope 3 | 3.28 | 3.39 | Per 1 million yen of sales | ||
| Total waste output | t | 321.5 | 340.3 | RL group | |
| Waste output: Intensity | 1.04 | 1.09 | Per 1 billion yen of sales | ||
| Waste output excluding valuable resources | t | 127.4 | 179.6 | RL Group | |
| Non-industrial waste recycling rate | % | 93.7 | 90.9 | Non-consolidated basis(RL) | |
| Water use | m3 | 6,277 | 7,362 | Includes only Techno Rent;16 sites Includes Techno Rent and Enplus from 2024; 17 sites | |
| Water use: Consumption rate | 20.36 | 23.33 | Per 1 billion yen of sales | ||
| Paper use | Thousand sheets | 630.2 | 662.7 | RL Group | |
| GHG(CO2) emissions Scope 3 emissions for each category | Cat1 | t-CO2 | 715,467 | 759,868 | RL Group |
| Cat13 | t-CO2 | 254,609 | 264,624 | RL Group | |
| Recycling rate of Ricoh products upon termination of lease contracts | % | 99.9 | 99.8 | ||
| Recycling rate of products other than Ricoh products upon termination of lease contracts | % | 85.7 | 85.5 | ||
Environmental targets and actual results in FY2024 Scope of report: Ricoh Leasing Company, Ltd.
The use of electricity derived from renewable energy and the introduction of eco-cars helped us achieve our CO2 emission reduction target for fiscal 2024 (730 t-CO2). On the other hand, we did not achieve our resource conservation target due to increased sales activities, which caused increases in waste and paper consumption.
| Environmental purpose | Environmental target | KPI | Target value | FY2024 results |
|---|---|---|---|---|
| Environmental burden reduction in business activities | Promotion of energy conservation | CO2 emissions | 730.0t-CO2 | 648.0t-CO2 |
| Electricity use (38 business sites) | No more than 738,000 kwh | 762,855 kwh | ||
| Hours of use of air conditioning (Toyosu) | Night hours and holidays: 2,000 | Night hours and holidays: 4,863 | ||
| Use of gasoline | No more than 111.5kl | 111.7kl | ||
| Fuel consumption improvement | 21.39km/l | 20.90km/l | ||
| Resources conservation | Paper purchases | No more than 3.95 million sheets | 4.36 million sheets | |
| Paper consumption reduction rate | More than 20.0% | 21.70% | ||
| Waste output | No more than 31.0t | 36.0t |
Environmental accounting
The Ricoh Leasing Group calculates environmental accounting items and analyzes the cost-benefit performance of environmental conservation Scope of report: Ricoh Leasing Company, Ltd. (excluding consolidated employees) activities, in order to promote environmental management. Results of analysis are used for decision-making, etc., in environmental management. Period covered: April 1, 2024–March 31, 2025 Scope of tabulation: Ricoh Leasing Company, Ltd., Techno Rent Co., Ltd.
1.Environmental conservation cost
Environmental investments increased by 8.3 million yen from the previous year due to the proactive introduction of eco-cars. In addition, environmental expenses increased by 50.3 million yen from the previous year due to higher upstream/downstream environmental costs resulting from end-of-lease collection expenses.
| Classification | FY2023 | FY2024 | |||
|---|---|---|---|---|---|
| Environmental investment | Environmental expenses | Content of major initiatives | Environmental investment | Environmental expenses | |
| 1.Costs within business premises | 12.79 | 11.66 | - | 21.12 | 15.89 |
| (1)Global environment conservation cost | 11.91 | 10.61 | Energy conservation (computer replacement, etc.) | 19.53 | 14.57 |
| (2)Resource recycling cost | 0.88 | 1.05 | Resource saving (reduction of paper use, etc.) | 1.59 | 1.32 |
| 2.Upstream and downstream cost | 0.00 | 540.95 | Expenses for collection, disposal, etc. of equipment upon termination of lease contracts | 0.00 | 582.18 |
| 3.Cost for management activities | 0.00 | 72.43 | Cost for environmental activities, integrated report production expenses,EMS (Environmental Management System) accreditation expenses, etc. | 0.00 | 77.03 |
| 4.Social activities cost | 0.00 | 9.89 | The Green Donation, etc. | 0.00 | 10.17 |
| 5.Environmental remediation cost | 0.00 | 0.00 | - | 0.00 | 0.00 |
| Total | 12.79 | 634.93 | - | 21.12 | 685.27 |
2.Environmental conservation effect
Although energy consumption increased due to increased sales activities and an increase in the number of Group companies, this was offset by emissions credits from renewable energy sources, resulting in a 114.8 t-CO2 reduction compared to the previous year.
| Item | FY2023 | FY2024 |
|---|---|---|
| Environmental burden reduction | Environmental burden reduction | |
| CO2 emissions (t-CO2) | 23 | 114.8 |
| NOx emissions (t) | 0.048 | 0.01 |
| Final waste disposal (t) (excluding Techno Rent Co., Ltd.) | 0.04 | (1.07) |
| Reduction in paper use (vs. previous year, thousand sheets) | (2.38) | (42.09) |
3.Economic impact
Upstream/downstream costs increased by 952.7 million yen over the previous year due to increased sales as a result of selling end-of-lease/rental equipment.
| Classification | FY2023 | FY2024 | |
|---|---|---|---|
| Monetary effect | Content of major initiatives | Environmental investment | |
| 1.Costs within business premises | 2.33 | - | (2.18) |
| (1)Global environment conservation cost | 1.84 | Energy conservation (reduction in gasoline, electricity use, etc.) | (2.97) |
| (2)Resource recycling cost | 0.49 | Resource saving (reduction of paper use, etc.) | 0.79 |
| 2.Upstream and downstream cost | 6,260.8 | Proceeds from sale of equipment upon lease contract termination | 7,213.5 |
| 3.Cost for management activities | 0.00 | - | 0.00 |
| 4.Social activities cost | 0.00 | - | 0.00 |
| 5.Environmental remediation cost | 0.00 | - | 0.00 |
| Total | 6,263.1 | - | 7,211.34 |
4.Environmental burden
This is as stated in "2. Environmental conservation effect."
| Item | FY2023 | FY2024 |
|---|---|---|
| Total volume | Total volume | |
| CO2 emissions (t-CO2) | 542.0 | 513.0 |
| NOx emissions (t) | 1.26 | 1.26 |
| Final waste disposal (t)(excluding Techno Rent Co., Ltd.) | 2.23 | 3.30 |
| Volume of paper use (thousand sheets) | 630.23 | 662.68 |
| Waste emissions (t) | 345.16 | 336.72 |
| Non-industrial waste (t) | 39.46 | 39.01 |
| Industrial waste (t) | 305.70 | 297.71 |
5.Environmental management indicators
The ratio of eco profit in fiscal 2024 increased slightly from the previous fiscal year due to the increase in equipment sales as stated in "3. Economic impact."
| Indicator | FY2023 | FY2024 |
|---|---|---|
| Ratio of eco profit: Economic impact/Environmental conservation cost | 9.86 | 10.52 |
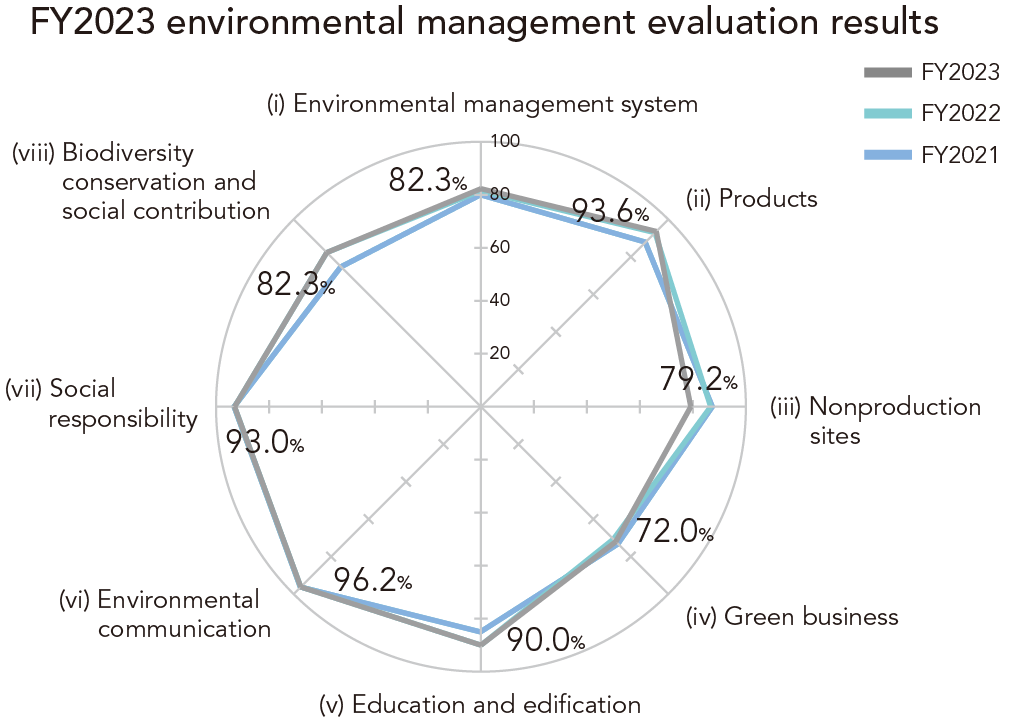
Environmental management evaluation system
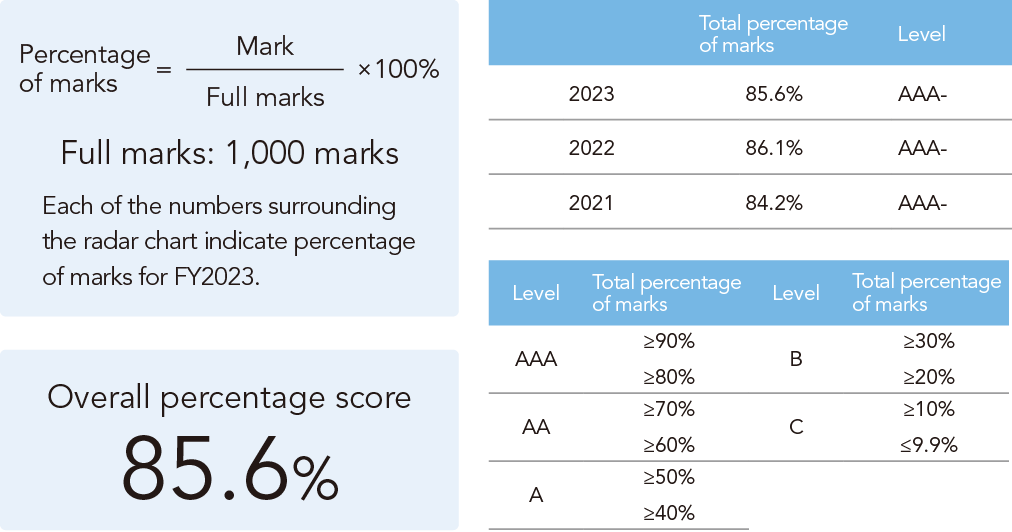
The Company inspects its own environmental management from various aspects using a unique environmental management evaluation system. The system is used as a tool to ascertain the Company’s position in relation to its environmental contribution and burden with respect to its business activities and develop medium- to long-term environmental targets and fiscal year policies. Evaluation results for fiscal 2024 are as shown below.
With regard to (ii) products and (iii) nonproduction sites, a decrease in the equipment collection rate and increase in paper consumption, respectively, resulted in lower points for each category. However, in (ix) biodiversity conservation and social contribution/external evaluations, a point increase was earned from the start of overseas greening activities for the reforestation of the Chiba seawall forest and earning the highest rating in the CDP Climate Change Report.
Based on these results, in fiscal 2024, we will continue our efforts to contribute to the environment through our businesses, aiming to increase the recovery rate and reduce paper consumption for (iii) nonproduction sites.
FY2024 environmental management evaluation results